- Threshold cryptography is a threshold cryptosystem, which is a cryptosystem that disperses encrypted data among a group of fault-tolerant computers to secure it.
- A public key is used to encrypt the message, and the involved parties share the associated private key.
- With a threshold cryptosystem, many parties (more than a threshold number) must collaborate on the decryption or signature procedure to decrypt an encrypted message.
The Present Market Price of the T Token is $0.02309. The value of T Token’s market on 30 October 2023 is $215.02 million. T Token is the native cryptocurrency of Threshold Network.
1-D Technical Index of T
On the other hand, the 100-day simple moving average (SMA) indicates a buying preference at the current market price of $0.02021. Furthermore, the 200-day SMA also points to buying momentum at $0.02313.
The 100-day EMA signals buying interest at the $0.02095 price point. In addition, the 200-day exponential moving average (EMA) suggests selling potential at $0.02501.
Market Information About Threshold Token
Threshold Token’s market valuation increased by 2.94% at the present. Volume increased by 43.47% in the last 24 hours. The ratio of tokens is unequal. It is now ranked 140th among 8,825 active cryptocurrencies in the world by market valuation. The liquidity of the T cryptocurrency is 5.89%. $445,085 worth of T $13.23 million Tokens were traded the prior day.
The market supply of T Tokens is currently 9.312 billion. There are a total of 10.515 billion T Tokens in the market.
Technical Analysis of TUSD
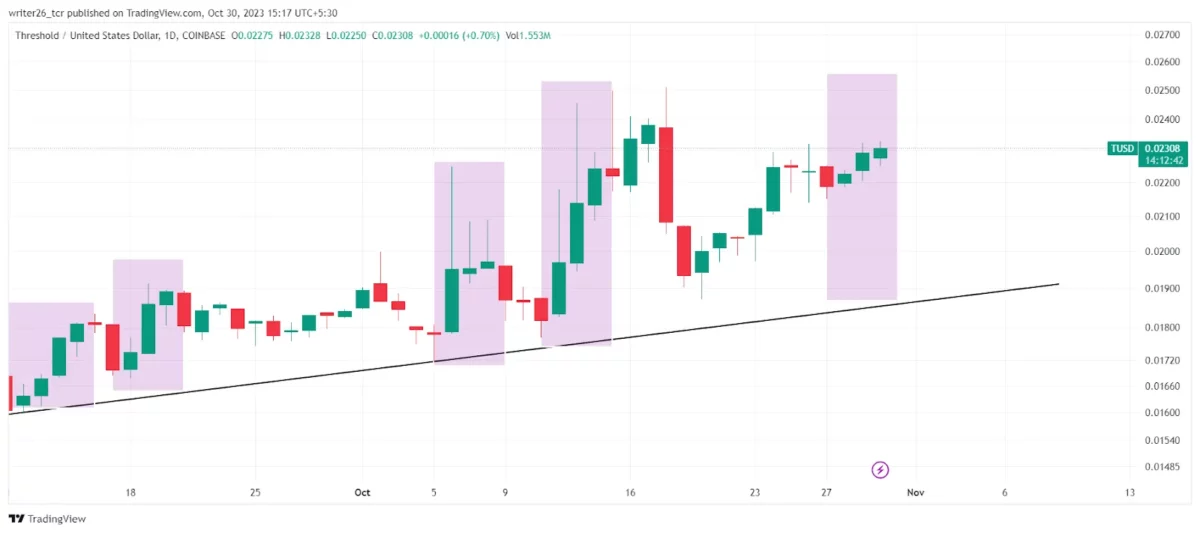
The T coin price reached its all-time high on January 26, 2023, in the 1-D time frame, which was around $0.0.06390. The threshold coin is up by 0.31% today. As we can see, the T coin began to go in an uptrend motion. Since September 2023, it has been moving in the same upward pattern.
The rising three patterns indicate that the coin was under the presence of bulls in recent times. This pattern implies that it might continue to move upward in the future. The T coin in the last 6 months is down by 25.79% and last month T Token, was up by 25.77%. In the Last 5 years, the T coin has been down by 59%. T Token was down by 59% in the last year. In the 7-D analysis, the T coin is up by 12.31%.
Conclusion
According to predictions made by advisors, Threshold Token might fall to $0.021286 by 4 November 2023. This would be equivalent to a drop in value by 7.25%, which is significant for any token.
Technical Levels
Support level- $0.01648 and $0.01455
Resistance level- $0.01974 and $0.02105
Disclaimer
The views and opinions stated by the author, or any people named in this article, are for informational purposes only and do not establish financial, investment, or other advice. Investing in or trading crypto or stock comes with a risk of financial loss.