- WBT coin is a utility token of WhiteBit which is the largest cryptocurrency exchange in Europe.
- WBT coin in the monthly time frame, is exactly the same as a horizontal or straight line.
- In this article, we will analyze the price of WBT coins.
In the overall time frame, the coin is down by (5%) and it is around $5.30 in today’s trading day.
The coin is doing well in the monthly, weekly, and daily time frames. The coin has the potential to generate good returns in the future.
In this article, we will predict as well as analyze the price of whitebit coin through technical analysis.
Technical Analysis of WBT(Yearly)
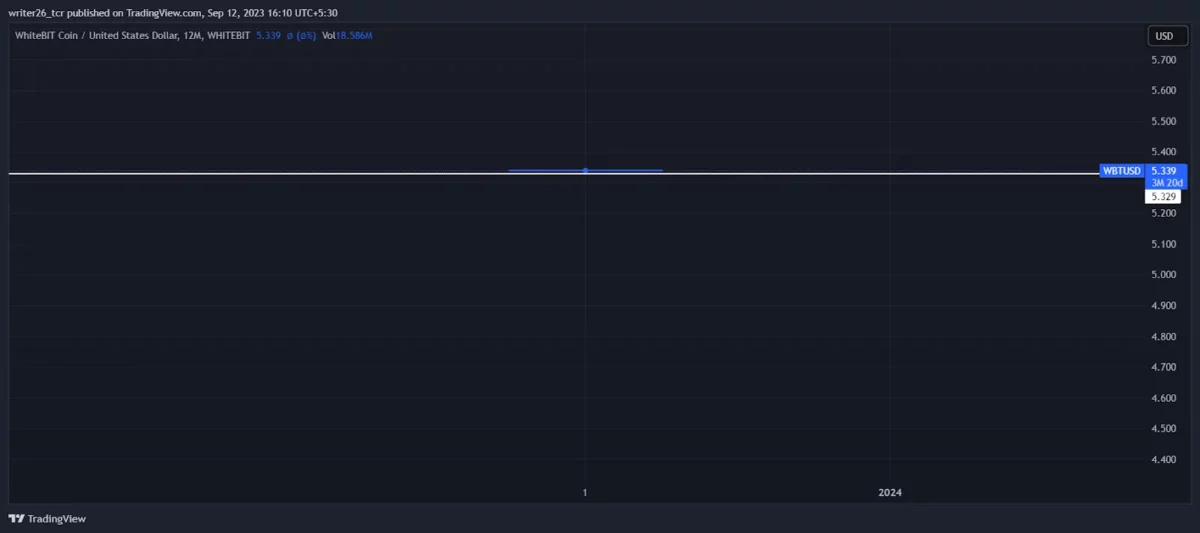
Source: WHITEBIT: WBTUSD by Trading View
We can clearly see that the coin is forming a straight line. It came into the market in 2023 only. It was up by 17.35% in the yearly time frame.
According to some forecasts, the coin may drop down to $5.10 or might drop by (4.63%) by 15th September 2023.
F&G(Fear and Greed) Index is showing 30(fear). The market sentiments are bullish in nature near the current market price.
Technical Analysis of WBT(Monthly)
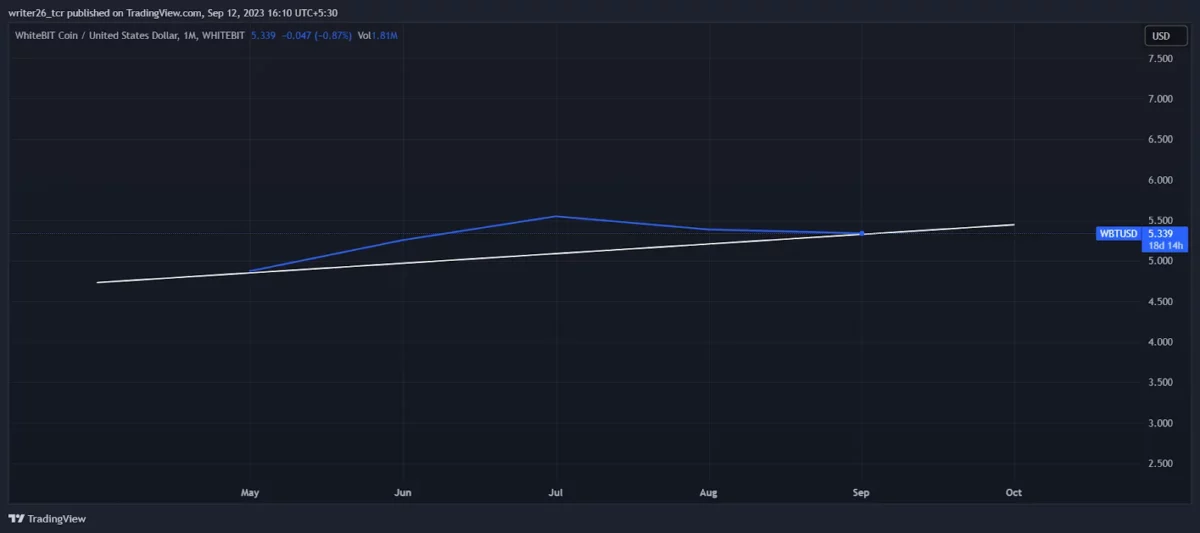
Source: WHITEBIT: WBTUSD by Trading View
In the last 30 days, the coin recorded 15/30 days green which is around 40%. The price volatility was 1.86%.
The coin made another support on the trend line. It might continue its upward movement.
It was down by 4.40% last month. According to some reports given by coin codex, the coin might go up to $5.94 in the next trading day.
Technical Analysis of WBT(Weekly)
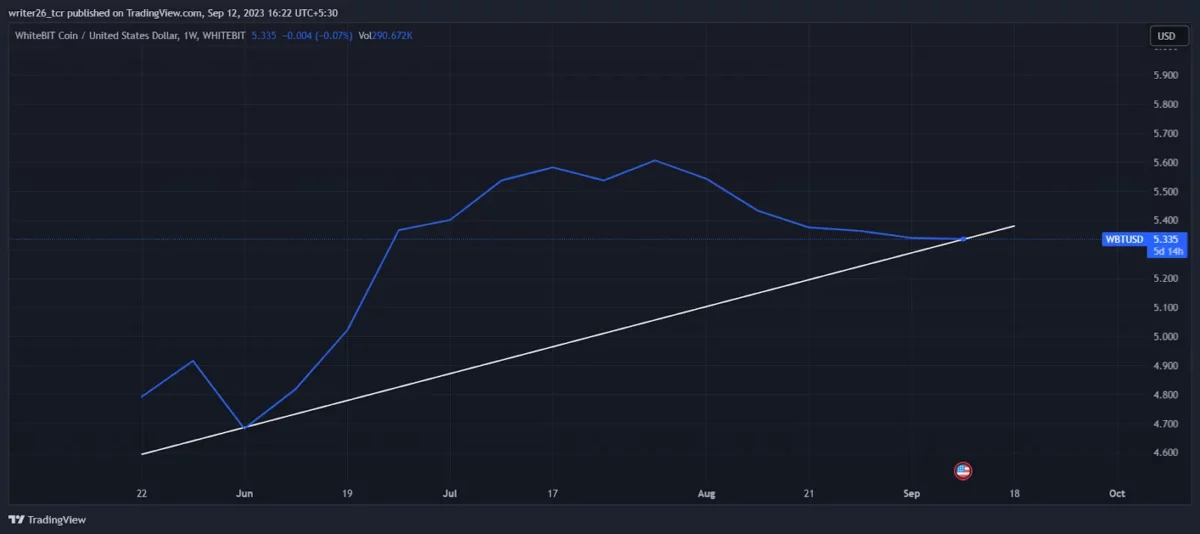
Source: WHITEBIT: WBTUSD by Trading View
In the weekly time frame, the coin might take off by using the trend. The coin already made a support point on that line.
The chances of moving up increase. As in the monthly time frame, the coin near market price is on the trend.
The coin was down by (0.25%) in the last seven days. Now look at the candlestick pattern.
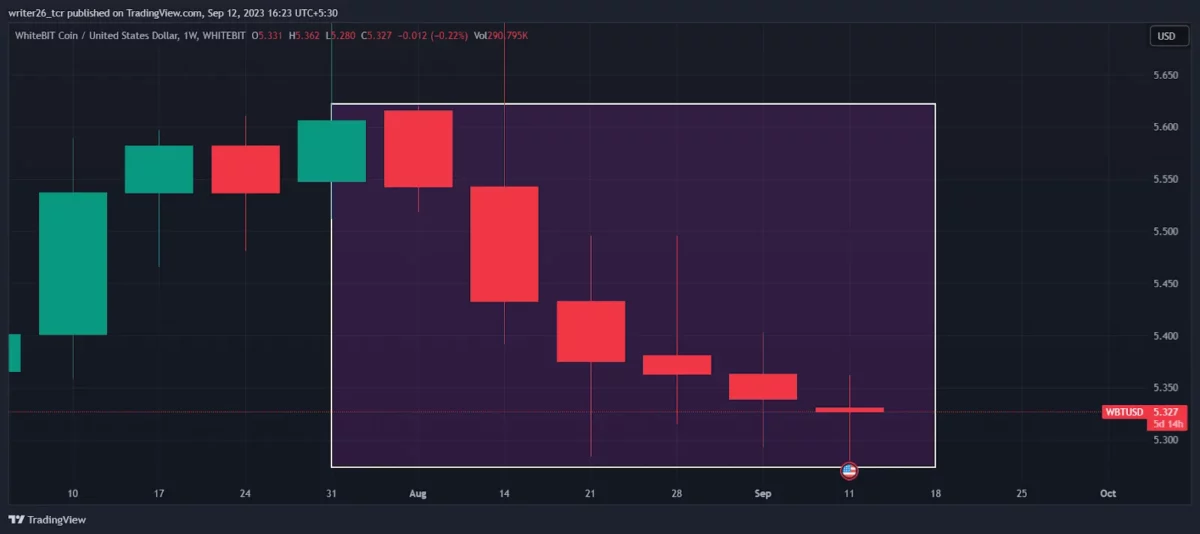
Source: WHITEBIT: WBTUSD by Trading View
We can clearly see, the pattern appeared 2 times in a row which means it will continue the down movement.
Three black crows appear in an uptrend and indicate that the price will fall in the future.
Technical Analysis of WhiteBit Coin (Daily)
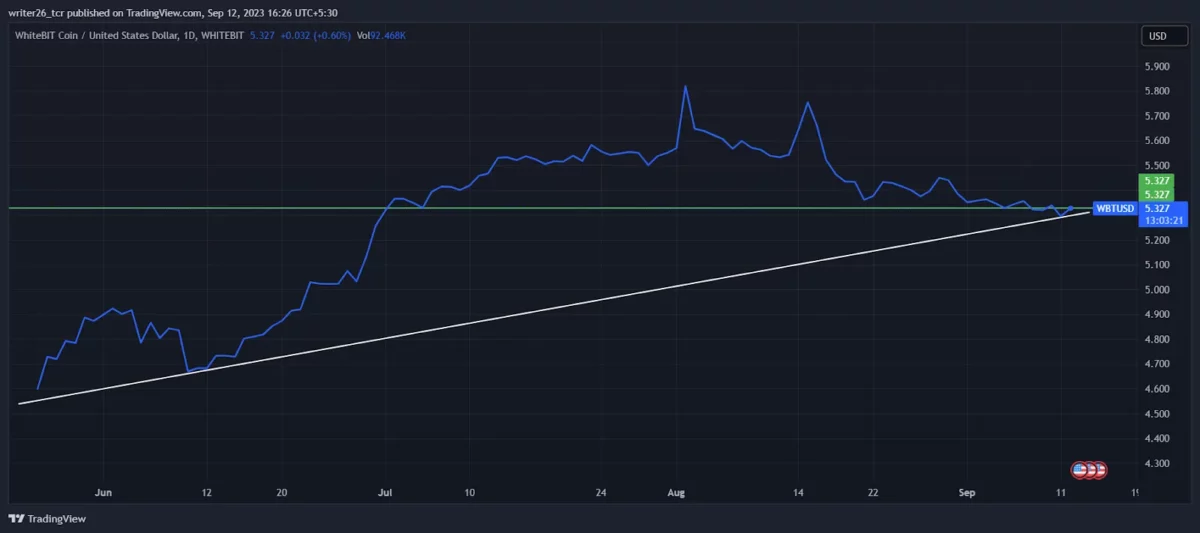
Source: WHITEBIT: WBTUSD by Trading View
The coin in the daily time frame is in uptrend. The opportunity to invest in the coin is near the current price.
It is down by (0.17%) in today’s trading session. The coin will perform well if the exchange is performing well.
The support level might also help the coin to continue the upward movement.
Summary
Through the technical analysis, we can conclude that the coin is not performing well in the weekly and daily time frame.
In the daily time frame, it is uptrend. In the weekly time frame, according to Candlestick it may move lower in the future.
In the monthly and yearly time frame, the coin is not giving proper information. It is new in the market.
Crypto investors should have proper knowledge about the cryptocurrency market.
Levels
Resistance Level- $5.546
Support Level- $5.321
Disclaimer
The analysis is done for providing information through technical analysis and no investment suggestions are given in the article to be made by investors.
The coins are unpredictable so investors should have proper knowledge.
Cryptocurrencies are highly volatile and risky. Investment should be made with proper technical analysis.