- TON was trading at $2.094 with an increase of 1.03% in the last 24 hours.
- Its price has confirmed the break below the bullish trendline.
- The 50-day EMA is moving above the 200-day EMA.
Toncoin (TON) is a decentralized layer-1 blockchain that was created in 2018 by the encrypted instant messaging platform Telegram. The project was then forsaken, and taken over by the TON Foundation, and was renamed from “Telegram Open Network” to “The Open Network”.
The token has recorded a positive ROI of 74.51% in the last three months. It marked a yearly high of $2.6 in September. The 50-day EMA gave a “Golden Cross” above the 200-day EMA in the daily timeframe at the end of September, which indicates the shift towards a bullish trend. The price is trying to sustain above the 50-day EMA as the bears of the market are pushing the price down.
It has broken below the bullish trendline but is still taking support from the levels of $1.895 to $1.975 and is trying to sustain its bullish movement. The price is also getting rejected from the resistance levels from $2.155 to $2.217.
67.99% of the total supply of the token is presently circulating in the market. Its trading volume has surged by 26.64% in the last 24 hours. It has a current market capitalization of $7.19 Billion.
Sentiment Analysis
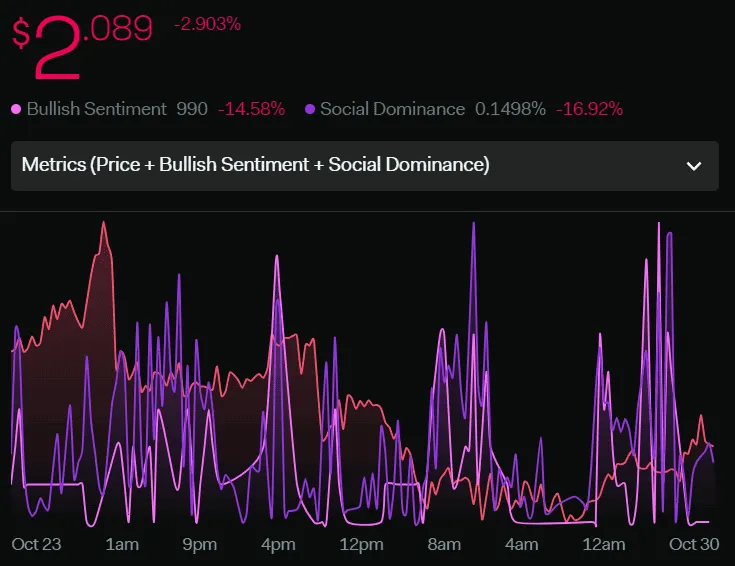
The price of the token has declined by 2.90% within a week. Its social dominance has dropped by 16.92% which shows that there is a decrease in the “share of voice”. Bullish sentiments have dropped by 14.58% as investors are not so bullish on the price and the price is also on the bearish side.
Technical Analysis of TON Token (Daily-1D)
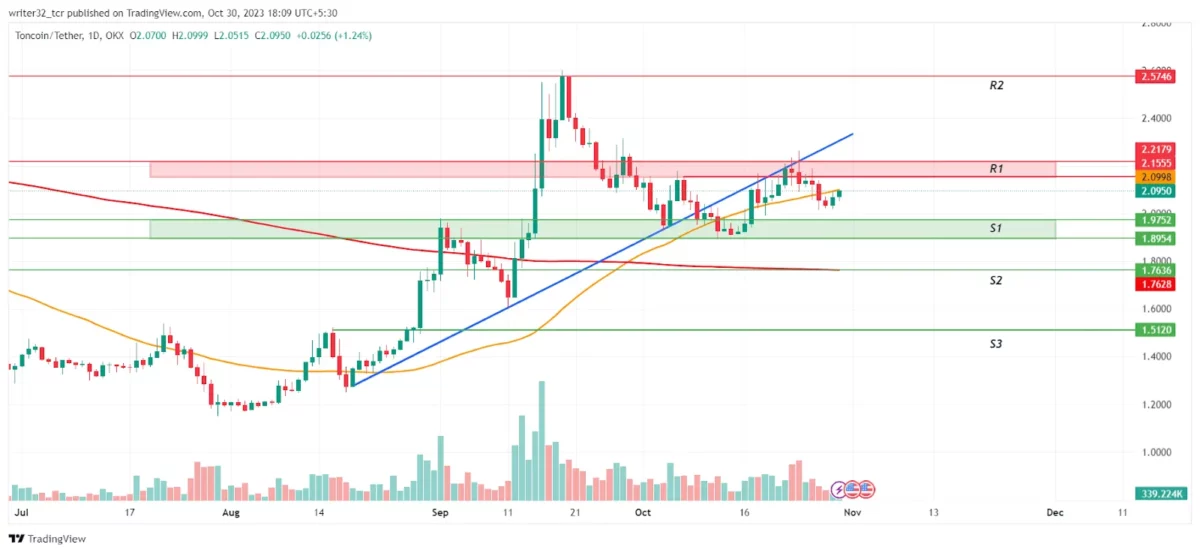
The TON token price has successfully given a breakout below the bullish trendline. If the price gets rejected from the 50-day EMA and gets below the support levels from $1.895 to $1.975, then the price can take support from the 200-day EMA and move up again for its next bullish move.
If the price regains support at the 50-day EMA, then it can continue to move in an uptrend. Once the price breaks the resistance levels of $2.155 to $2.217, The price can reach the level of $2.574 and soar even higher.
However, If the price loses support from the 200-day EMA, then the price will get bearish again and start a downtrend.
Indicators on the Price of TON Token
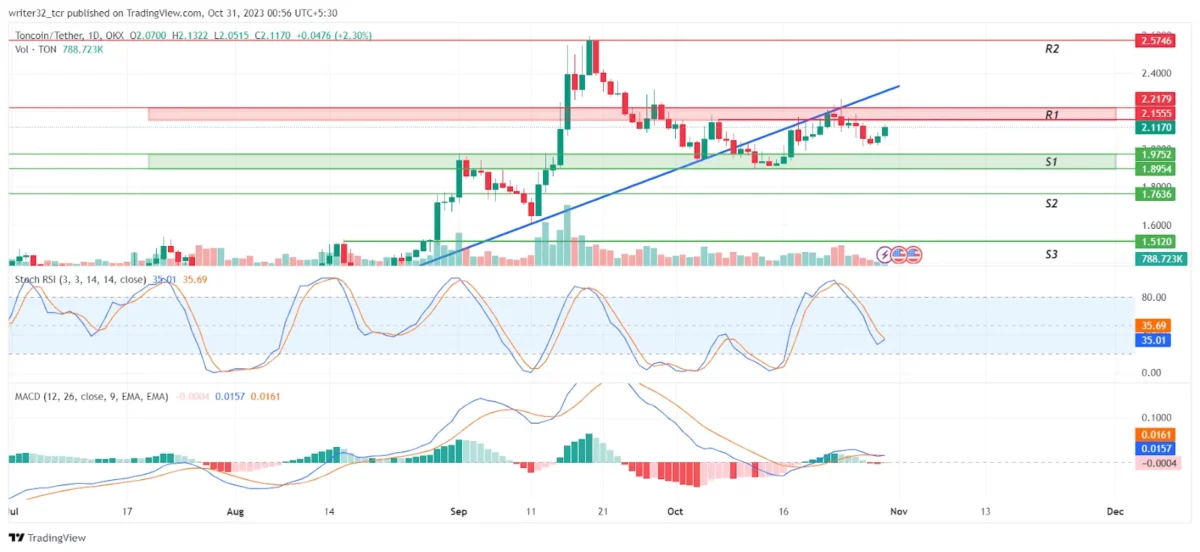
Moving Average Convergence/Divergence (MACD)
The volumes in the histogram do not give any movement. There is no confirmation as the volumes are irrelevant. The fast blue line moving average is also struggling to move above the red slow line moving average due to insignificant movement in the volumes.
Stochastic RSI
The stochastic RSI shows that the price is near the oversold region. The %K line is trying to make a bullish cross with the %D line. The cross will be bullish for the price and the price can start moving upwards.
Conclusion
The overall analysis of the TON token suggests that the token is presently showing signs of a bearish trend as the volumes are insignificant and the price has broken below the trendline, going down from the 50-day EMA. However, If the price regains support at the 50-day EMA, the price can continue its upward movement.
Technical Levels
Support Level: $1.895 to $1.975, $1.763 and $1.512
Resistance Level: $2.155 to $2.217 and $2.574
Disclaimer:
The views and opinions stated by the author, or any people named in this article, are for informational purposes only and do not establish financial, investment, or other advice. Investing in or trading crypto assets comes with a risk of financial loss.