- Pinterest Inc. (PINS) stock is showing a bullish strength and the price has given a breakout from a triangle pattern.
- Pinterest stock has a target price of $34.9 for the upcoming year according to analysts’ ratings.
- Pinterest Inc.’s free cash flow is $103 Million for Q3 2023 and it increased by 54.8% YoY.
Pinterest Inc. is involved in running a digital platform with a pinboard-style concept, focusing on sharing images. Users can curate and organize collections of images based on various themes, including interests, hobbies, and events.
The share price of Pinterest Inc. is on an upward trajectory. In the weekly timeframe, the stock has experienced a reversal, forming a pattern of higher highs.
For Q3 2023, the company has generated a free cash flow of $103 Million, representing a significant 54.8% annual increase. This rise in cash flow is indicative of the company’s strong performance.
The technical indicator summary from TradingView provides a buy signal for the Pinterest stock. Among the 26 indicators analyzed, a majority of them suggest a buy signal, indicating the potential for an upward movement in the future.
Pinterest Inc. stock reached a high of $89.80 before entering a downtrend, resulting in an approximately 81% decline. However, the stock found support at the $16 level and reversed its course. The price has formed a triangle pattern, and recently, it broke out from this pattern, signaling the potential for positive momentum.
The overall structure of Pinterest Inc. stock appears positive, and the price is likely to rise in the upcoming days.
Over the past six months, the stock price has surged by over 47%, reflecting a strengthening positive momentum.
Pinterest Inc. (PINS) Stock Technical Analysis
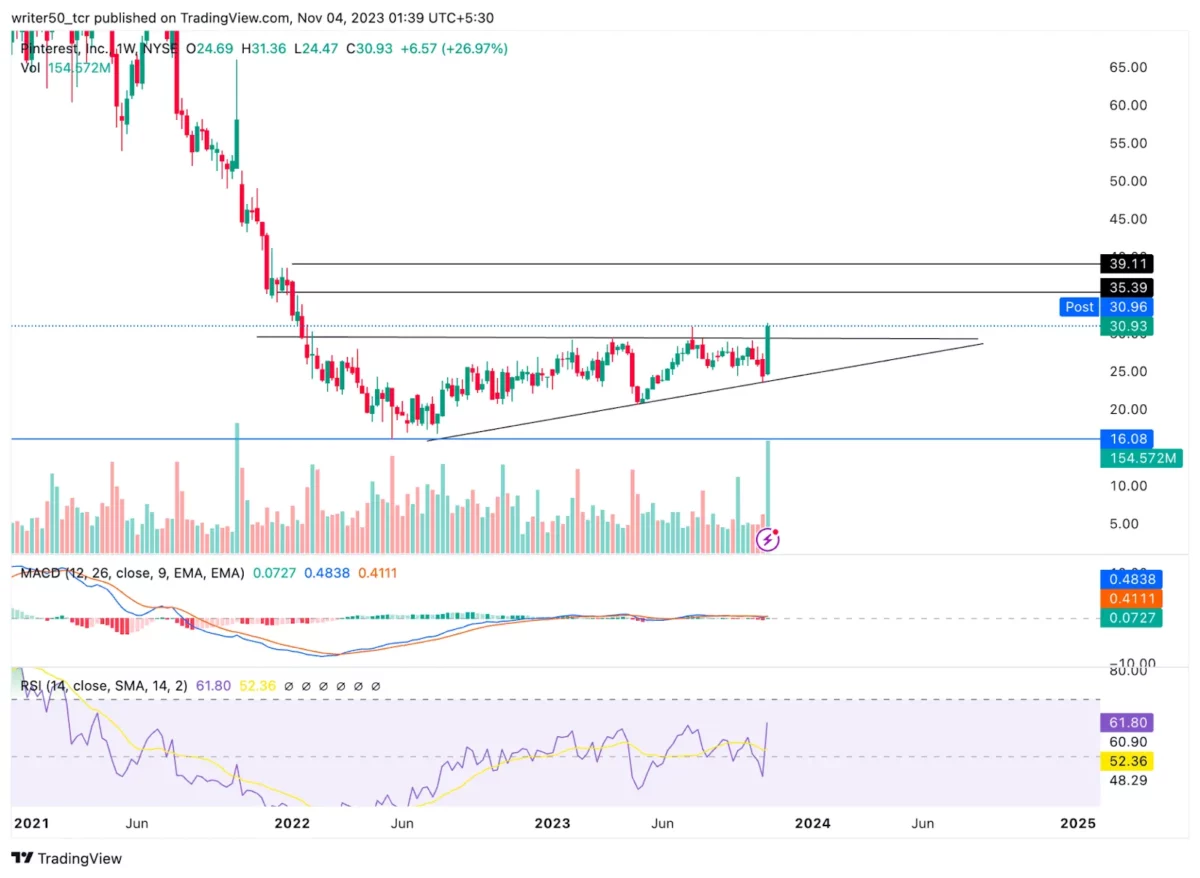
Pinterest Inc. (PINS) stock’s MACD line is situated above the signal line, accompanied by the presence of a green histogram, signaling the current bullish sentiment. This suggests the potential for future price rise for PINS.
Conversely, the RSI line for PINS stock is currently trading above the 14-day simple moving average (SMA) line, with both lines hovering near the 60 level. This strong RSI signal for PINS stock implies a likelihood of a future price rise.
Additionally, there has been an increase in stock volume, represented by larger green candles. This rising volume indicates that buyers are becoming more active and establishing fresh positions.
Conclusion
As per the analysis, the price of the PINS stock has moved out of the triangle pattern along with the formation of a higher high structure. The company has shown a positive return in the previous year and the overall structure of the stock is positive. Hence, the probability of the price rise increases with this.
Technical Levels
- Support Levels: $29.4 and $24
- Resistance Levels: $35.3 and $39.11
Disclaimer
The views and opinions of the author, or anyone named in this article, are for informational purposes only. They do not offer financial, investment, or other advice. Investing or trading crypto assets involves the risk of financial loss.