- Hedera is a distributed ledger technology that has been described as a substitute for blockchains.
- The HBAR coin was initially released in 2017 and the author was Leemon Baird.
- It is the native currency of the Hedera Hashgraph System.
The HBAR token is not performing well in the yearly time frame. The fall started in the year 2021. In 2022 the coin showed some up movement.
The coin is in the control of bears and the coin is making bearish patterns. The sellers or the bears are more present than the bulls.
In the overall time frame analysis the coin is down by (87.95%). The coin is currently in the recovery phase.
Technical Analysis of the HBAR Coin (Yearly)
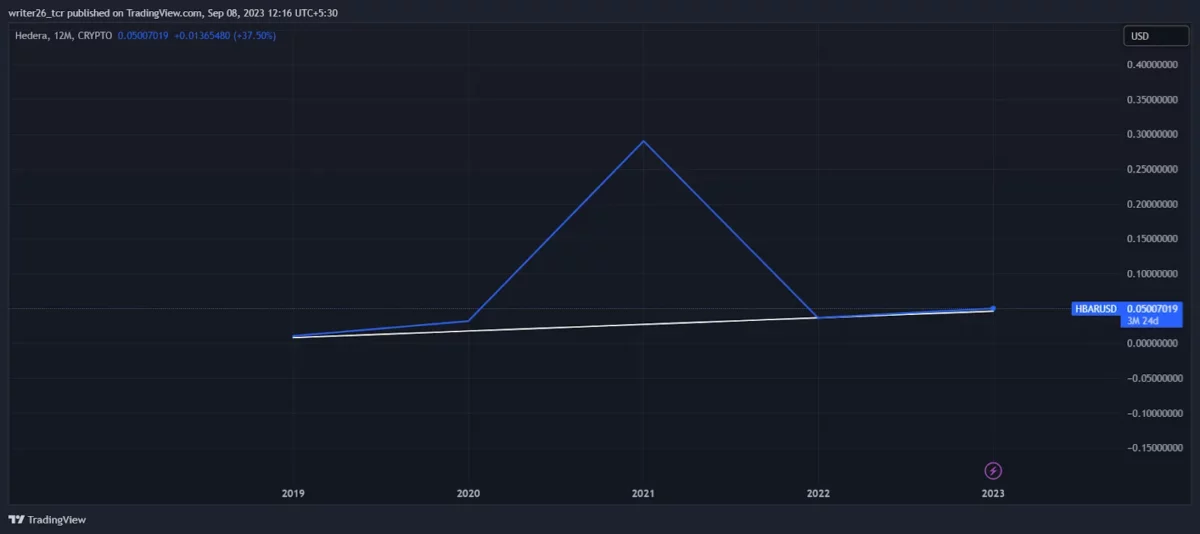
Source: CRYPTO: HBARUSD by Trading View
The coin is down by (17.91%) in the yearly time frame. As we can see in the chart the current market price is near the price at which it was listed.
All cryptocurrencies faced a lot of losses in the 2023 year because of many reasons. The main two reasons were:
- Fall in the price of Bitcoin (BTC).
- Bankruptcy of FTX, one of the biggest and most famous cryptocurrency exchanges.
In the United States, 60% of people believe that investing in cryptocurrencies is highly risky.
In 2021, the number was 45%, as the coin started to fall the percentage also increased.
The other 26% believed that the investment in cryptocurrencies is moderately risky.
Only 8% of Americans have a positive view of crypto assets.
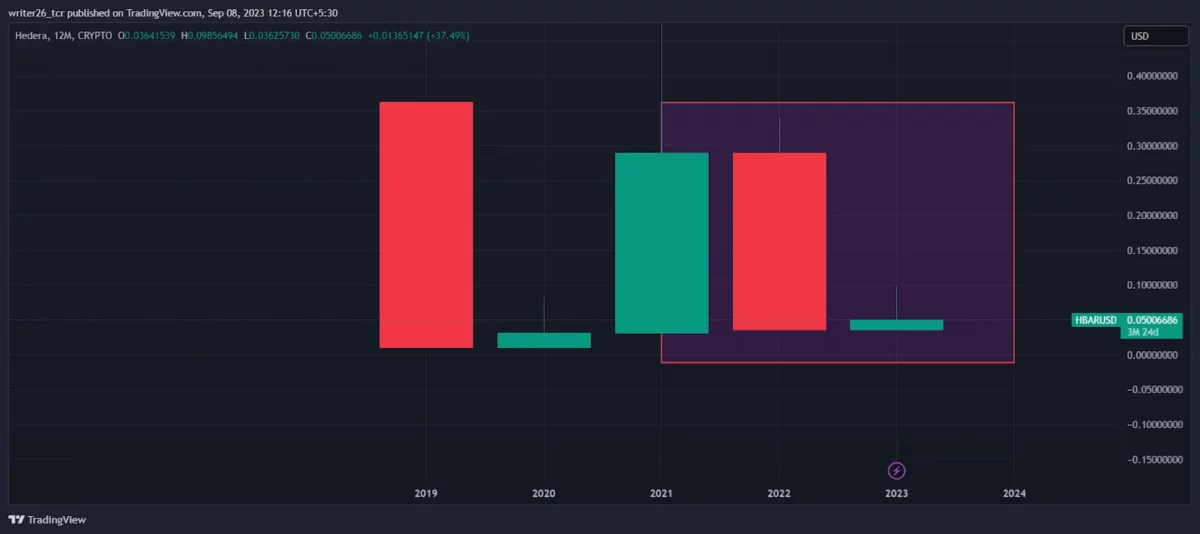
Source: CRYPTO: HBARUSD by Trading View
The pattern represents the bullish harami, which means the coin downtrend or bear trend may come to an end.
As we have seen in the line chart, the stock was moving in an upward direction. So, the pattern confirms that the stock may continue its upward flow.
In 2022, the digital currency market lost $2 trillion. The number is very big for a particular year.
Technical Analysis of the HBAR Coin (Monthly)
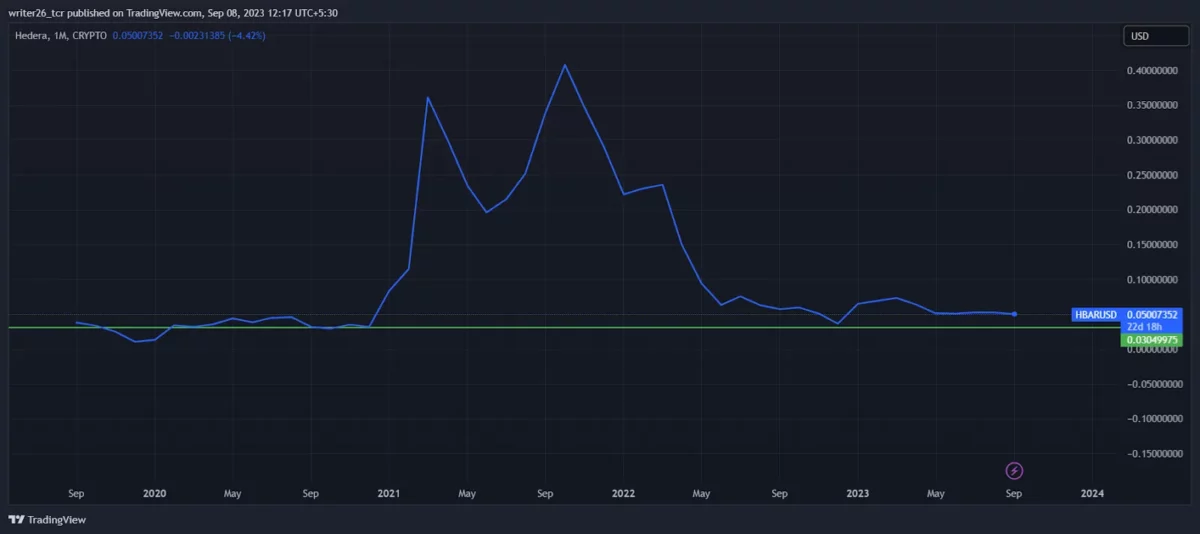
Source: CRYPTO: HBARUSD by Trading View
The coin overall is in a sideways position. From October 2021, the coin is in the down direction.
It is down by 13.62% in the monthly time frame. The coin made multiple support points on the support level.
So, the chance of going up is there because it might take another support and give some upward flow in the future.
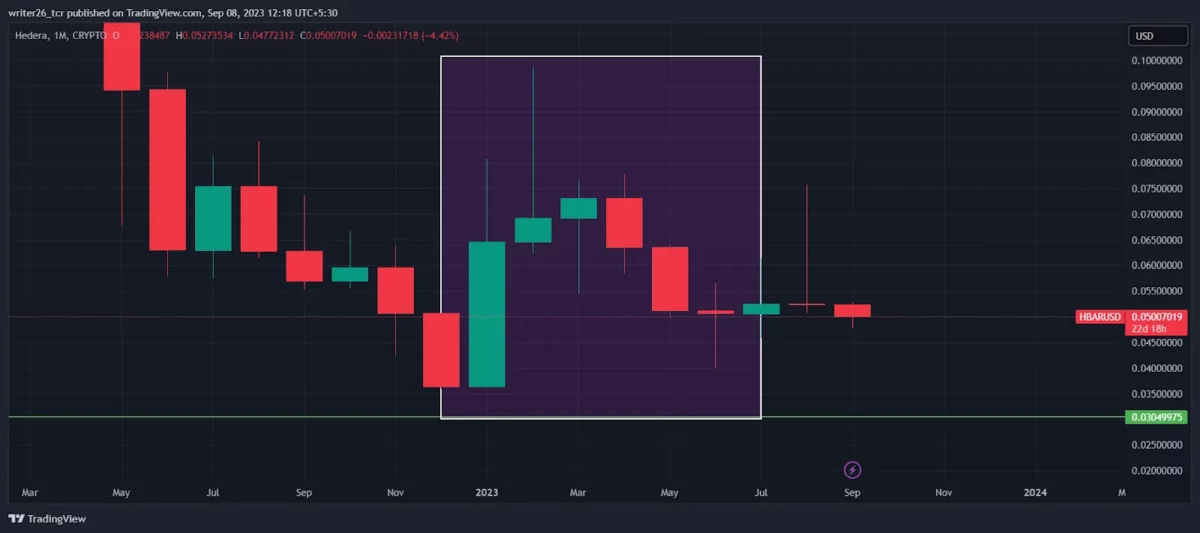
Source: CRYPTO: HBARUSD by Trading View
The coin made the three white soldiers pattern but couldn’t continue its movement. Soon after that, the three black crows come into the picture.
It continued the movement but in a downward direction. So, in the monthly time frame, the stock may retrace.
Technical Analysis of the HBAR Coin (Weekly)
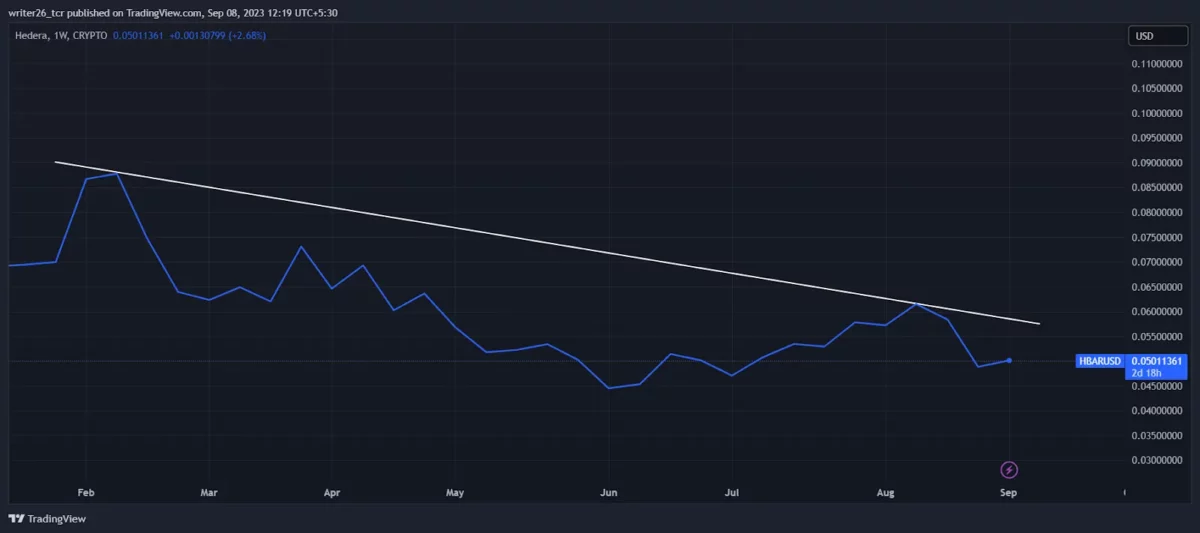
Source: CRYPTO: HBARUSD by Trading View
So as we can see, in the weekly time frame the coin is in a declining position. The investment is not fruitful for the investors because the coin is not performing well.
The coin is down by (1.7%) in the last seven days. The numbers are negative in all time frames except the daily time frame.
Technical Analysis of the HBAR Coin (Daily)
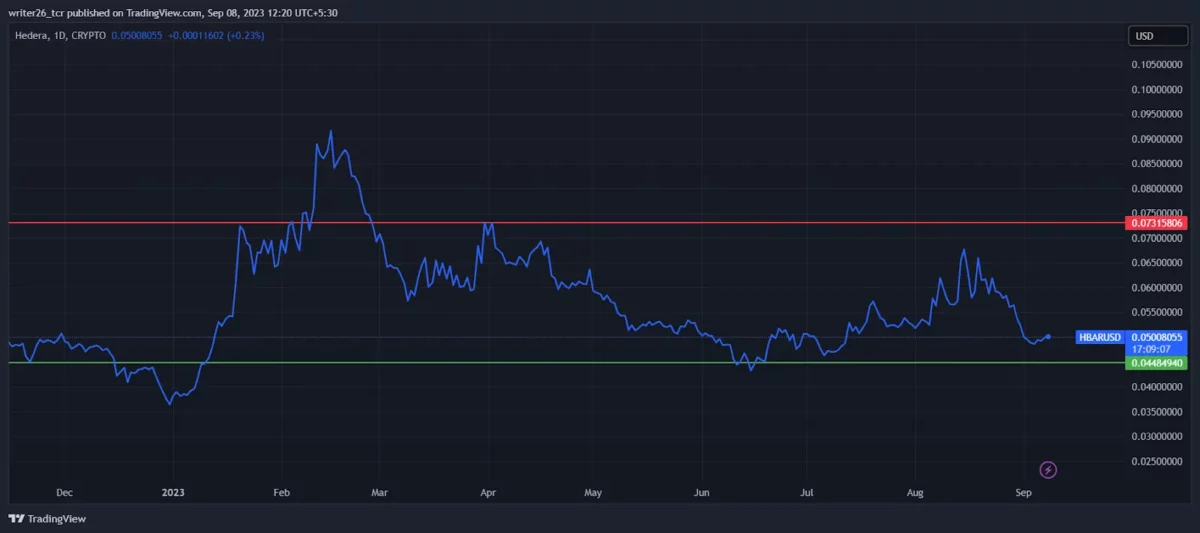
Source: CRYPTO: HBARUSD by Trading View
The coin is in the range between the support level and the resistance level. It is in a sideways position.
According to Binance, the coin may oscillate between $0.051 and $0.071 during all twelve months of 2023.
The coin is up by 2.35% in the daily time frame.
Conclusion
Through the technical analysis, we can conclude that the coin is not performing well.
In the past, it went up to $0.290 and now it is around $0.050. That is not a good sign. The investors have also lost their money as it drastically felt in 2022.
There were many reasons for the fall but now cryptocurrencies are slowly recovering from the downfall.
Technical Levels
- Resistance Level- $0.073
- Support Level- $0.044
Disclaimer
The analysis is done for providing information through technical analysis and no investment suggestions are given in the article to be made by investors.
The coins are unpredictable so investors should have proper knowledge.
Cryptocurrencies are highly volatile and risky. Investment should be made with proper technical analysis.