- The Fantom coin price has surged by about 40% from the lower level.
- The FTM coin has formed a descending triangle pattern.
- This token’s current market price is $0.2408.
In the current trading session, the Fantom coin is trading with a slight decline of $0.0005 or 0.21%. The total amount of volume that has been traded for the current session is $66,957,721. It is struggling to show some meaningful move on either side and has been trading in a flat range for the last six trading sessions.
Fantom Coin has been in a downtrend since the beginning of the year 2022. It created an all-time low of $0.001953 on 13 March 2020 and a high of $3.48 on 28 October 2021. Since then the coin price has been witnessing a downfall and is currently in a downtrend.
In 2023, the coin price started the year on a positive note and the price has seen a surge of over 230%. However, the gains did not last much and the coin price started to decline in the second month itself. The coin price declined massively from the above level and formed a lower high and lower low pattern. It confirms that the coin price is in a downtrend.
What the Price Action is Indicating about the Fantom Coin Price
The FTM coin price has formed a descending triangle pattern on the daily chart. It is currently trading very close to the upper trendline resistance of the pattern and is facing rejection from that trendline. The trendline is present near the level of $0.2551. However, the sellers are not looking strong to push the price down and the buyers are holding the price close to the trendline.
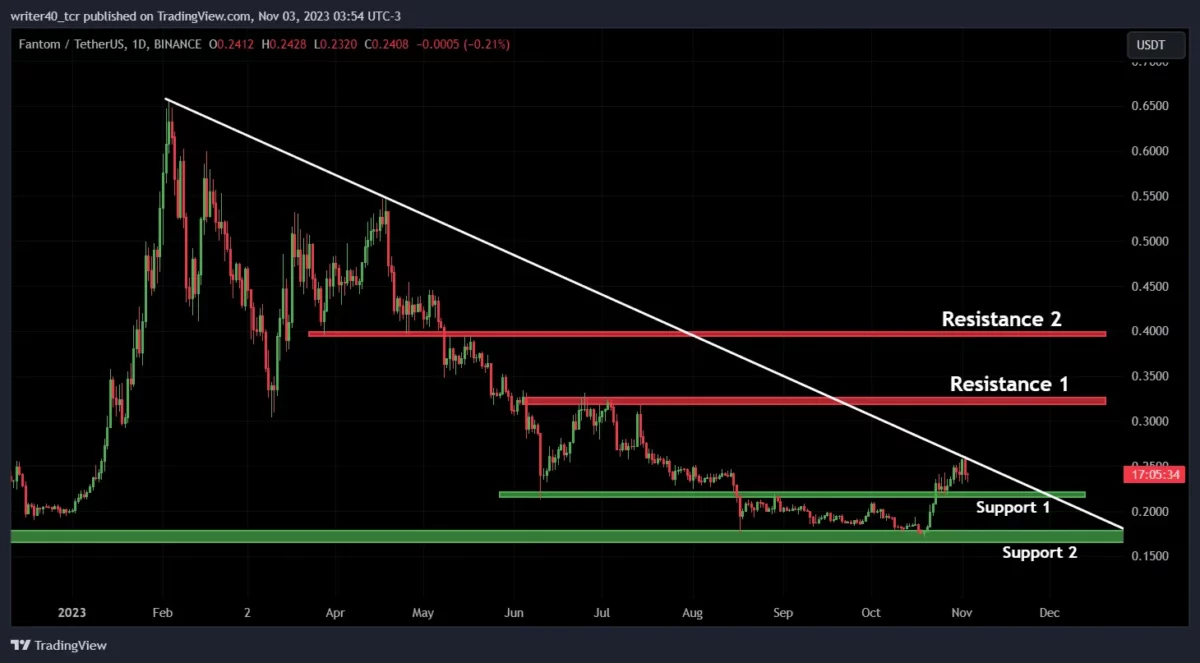
The FTM coin price has yet to break the descending triangle pattern and this pattern is generally considered a bearish pattern. So, if the coin price breaks this pattern on the downside, then it can move towards a much lower level. The current support for this price is present near the level of $0.2152 and $0.1650. If the price breaks the pattern on the upside, it can face resistance near the level of $0.3281 and $0.4000.
A Quick Glimpse of the Indicators Used in the Technical Analysis
The FTM coin price is challenging the sellers present near the 200-day Exponential Moving Average. However, the bulls have already defeated the sellers which were present near the 50-day EMA.
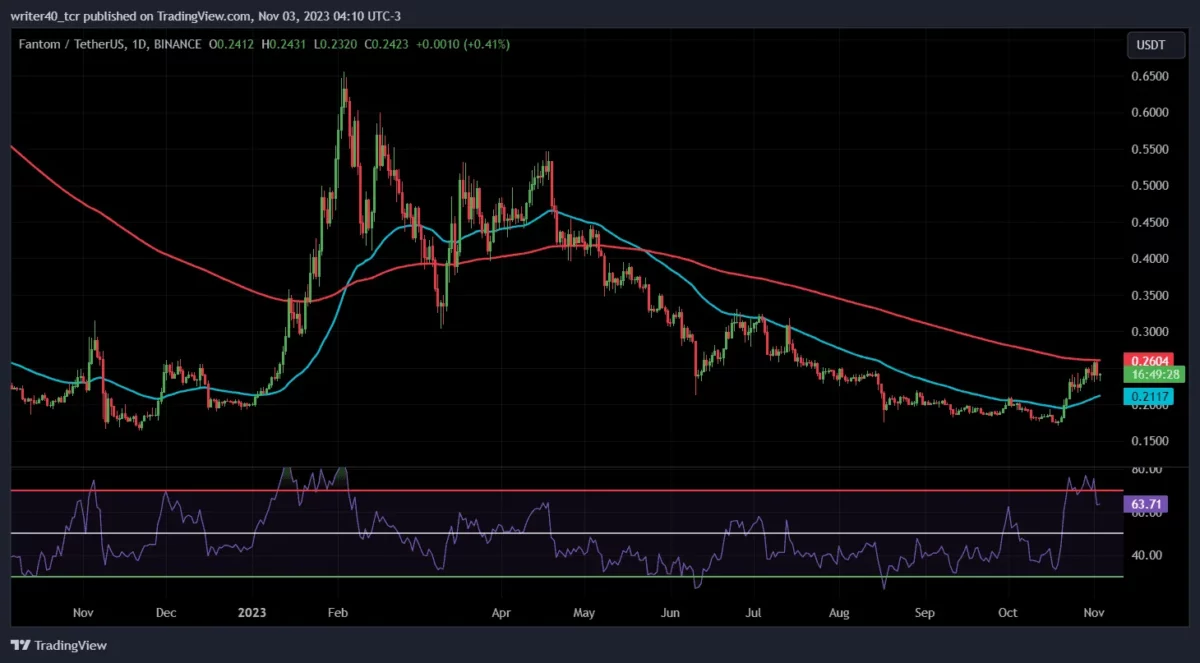
The Relative Strength Index (RSI) is curving at 63.86 and the curve of the RSI is sloping downward which shows that the bulls are losing the Momentum. However, the coin price has not shown any kind of weakness on the chart.
Conclusion
The FTM coin price has shown great strength in recent times and the price is looking bullish at present. However, the RSI is sloping downward and the price is facing a tough challenge of the 200-day EMA. If the price crosses the 200-day EMA, it can show some good upside ahead.
Technical level
Resistance – $0.3281 and $0.4000
Support – $0.2152 and $0.1650
Disclaimer
The views and opinions stated by the author, or any people named in this article, are for informational purposes only. They do not establish financial, investment, or other advice. Investing in or trading crypto assets comes with a risk of financial loss.