- LINK was trading at $11.16 with an intraday rise of 1.2%.
- The token has been within a strong consolidation zone for the last 18 months.
- It has seen a bullish increase of 60% in the last three weeks.
The Chainlink network was founded in 2017. Chainlink is a blockchain abstraction layer that allows secure universally connected smart contracts. Through a decentralized oracle network, Chainlink authorizes blockchains to safely interact with external data, events, feeds, and payment methods, by providing the critical off-chain information required by complex smart contracts to become the superior form of digital agreement.
In the previous bull run, the token marked its all-time high of $52.88 on 10 May 2021. Since then, the price has been moving in a downtrend. The price has been stuck in a strong consolidation zone for the last one and a half years, where the price was mostly between $5.8 to $8.6. This year, in the third week of October, the price gave a breakout from the major resistance levels of $8.4 to $9.5 and turned bullish.
Only 55.68% of the total supply of the token is presently circulating in the market. Its trading volume has surged by 55.25% in the last 24 hours. It has a current market capitalization of $6.23 Billion.
Sentiment Analysis
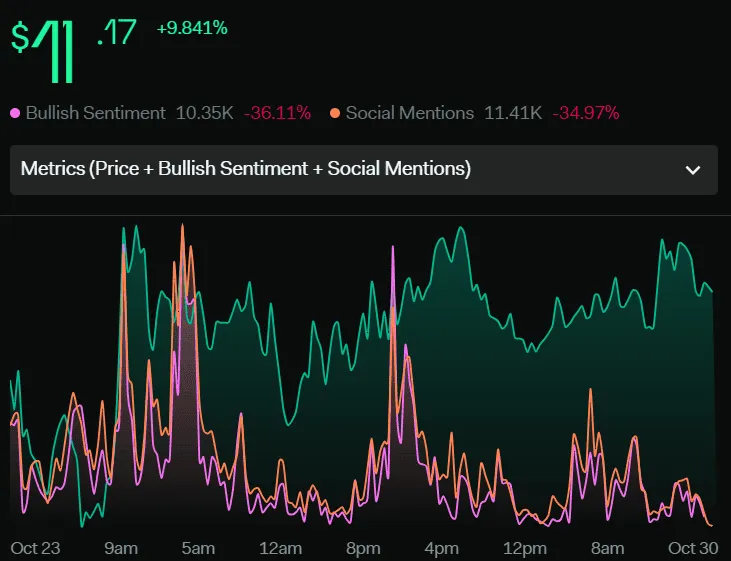
The volume of the token increased by 76% within a week which caused an upward movement in the price by 9.841%. Its social mentions have dropped by 34.97% and the total bullish sentiments have declined by 36.11%. The overall sentiments point toward an upcoming correction move in the price.
Technical Analysis Of LINK Token (Weekly-7D)
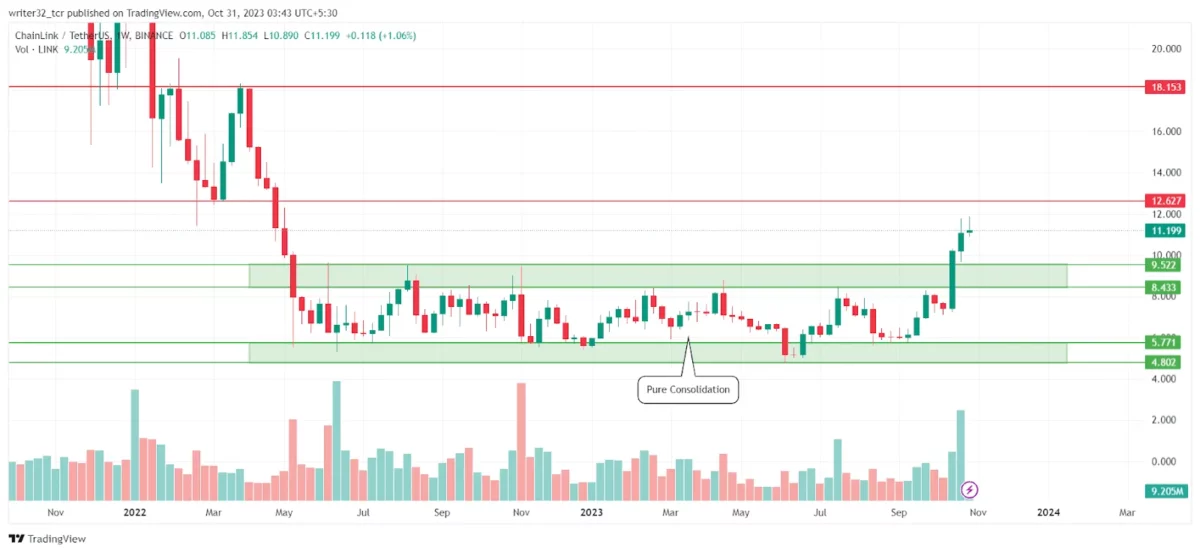
A pullback in LINK’s price can be expected from the current level for a correction move. Once the price retests the support levels of $8.4 to $9.5, then the price can move up to break the resistance level of $12.6 and target to reach the $18 range. Additionally, the price can go up to the level of $12.6 and then come down for a retest of the support level.
However, if the price breaks below the support levels of $8.4 to $9.5, then it can again fall to the levels of $4.8 to $5.7.
Indicators on the Price of LINK Token
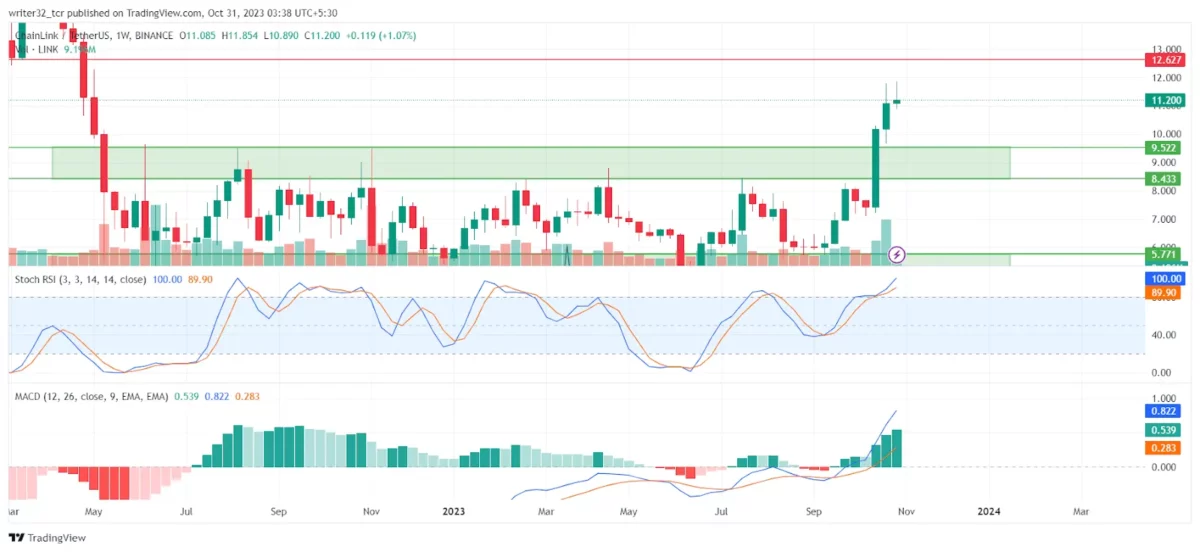
Moving Average Convergence/Divergence (MACD)
The volume has been increasing significantly in the histogram which resulted in the surge in the price in the last three weeks. The fast blue line moving average is above the baseline level 0, moving at 0.822. The MACD is giving a bullish sign.
Stochastic RSI
The stochastic RSI has reached extreme levels in the overbought region, from where the selling pressure might be applied on the buyers of the market.
Conclusion
The overall analysis of the LINK token indicates a bullish trend. It’s possible to anticipate a pullback to the support range of $8.4 to $9.5 from the $12.6 resistance level or the current price. A retest of the support range at $8.4 to $9.5 and a successful break above the $12.6 resistance level would confirm a continuation of the upward trend in the token’s price.
Technical Levels
Support Level: $4.8 to $5.7 and $8.4 to $9.5
Resistance Level: $12.62 and $18.15
Disclaimer:
The views and opinions stated by the author, or any people named in this article, are for informational purposes only and do not establish financial, investment, or other advice. Investing in or trading crypto assets comes with a risk of financial loss.